This product was not featured by Product Hunt yet. It will not be visible on their landing page and won't be ranked (cannot win product of the day regardless of upvotes).
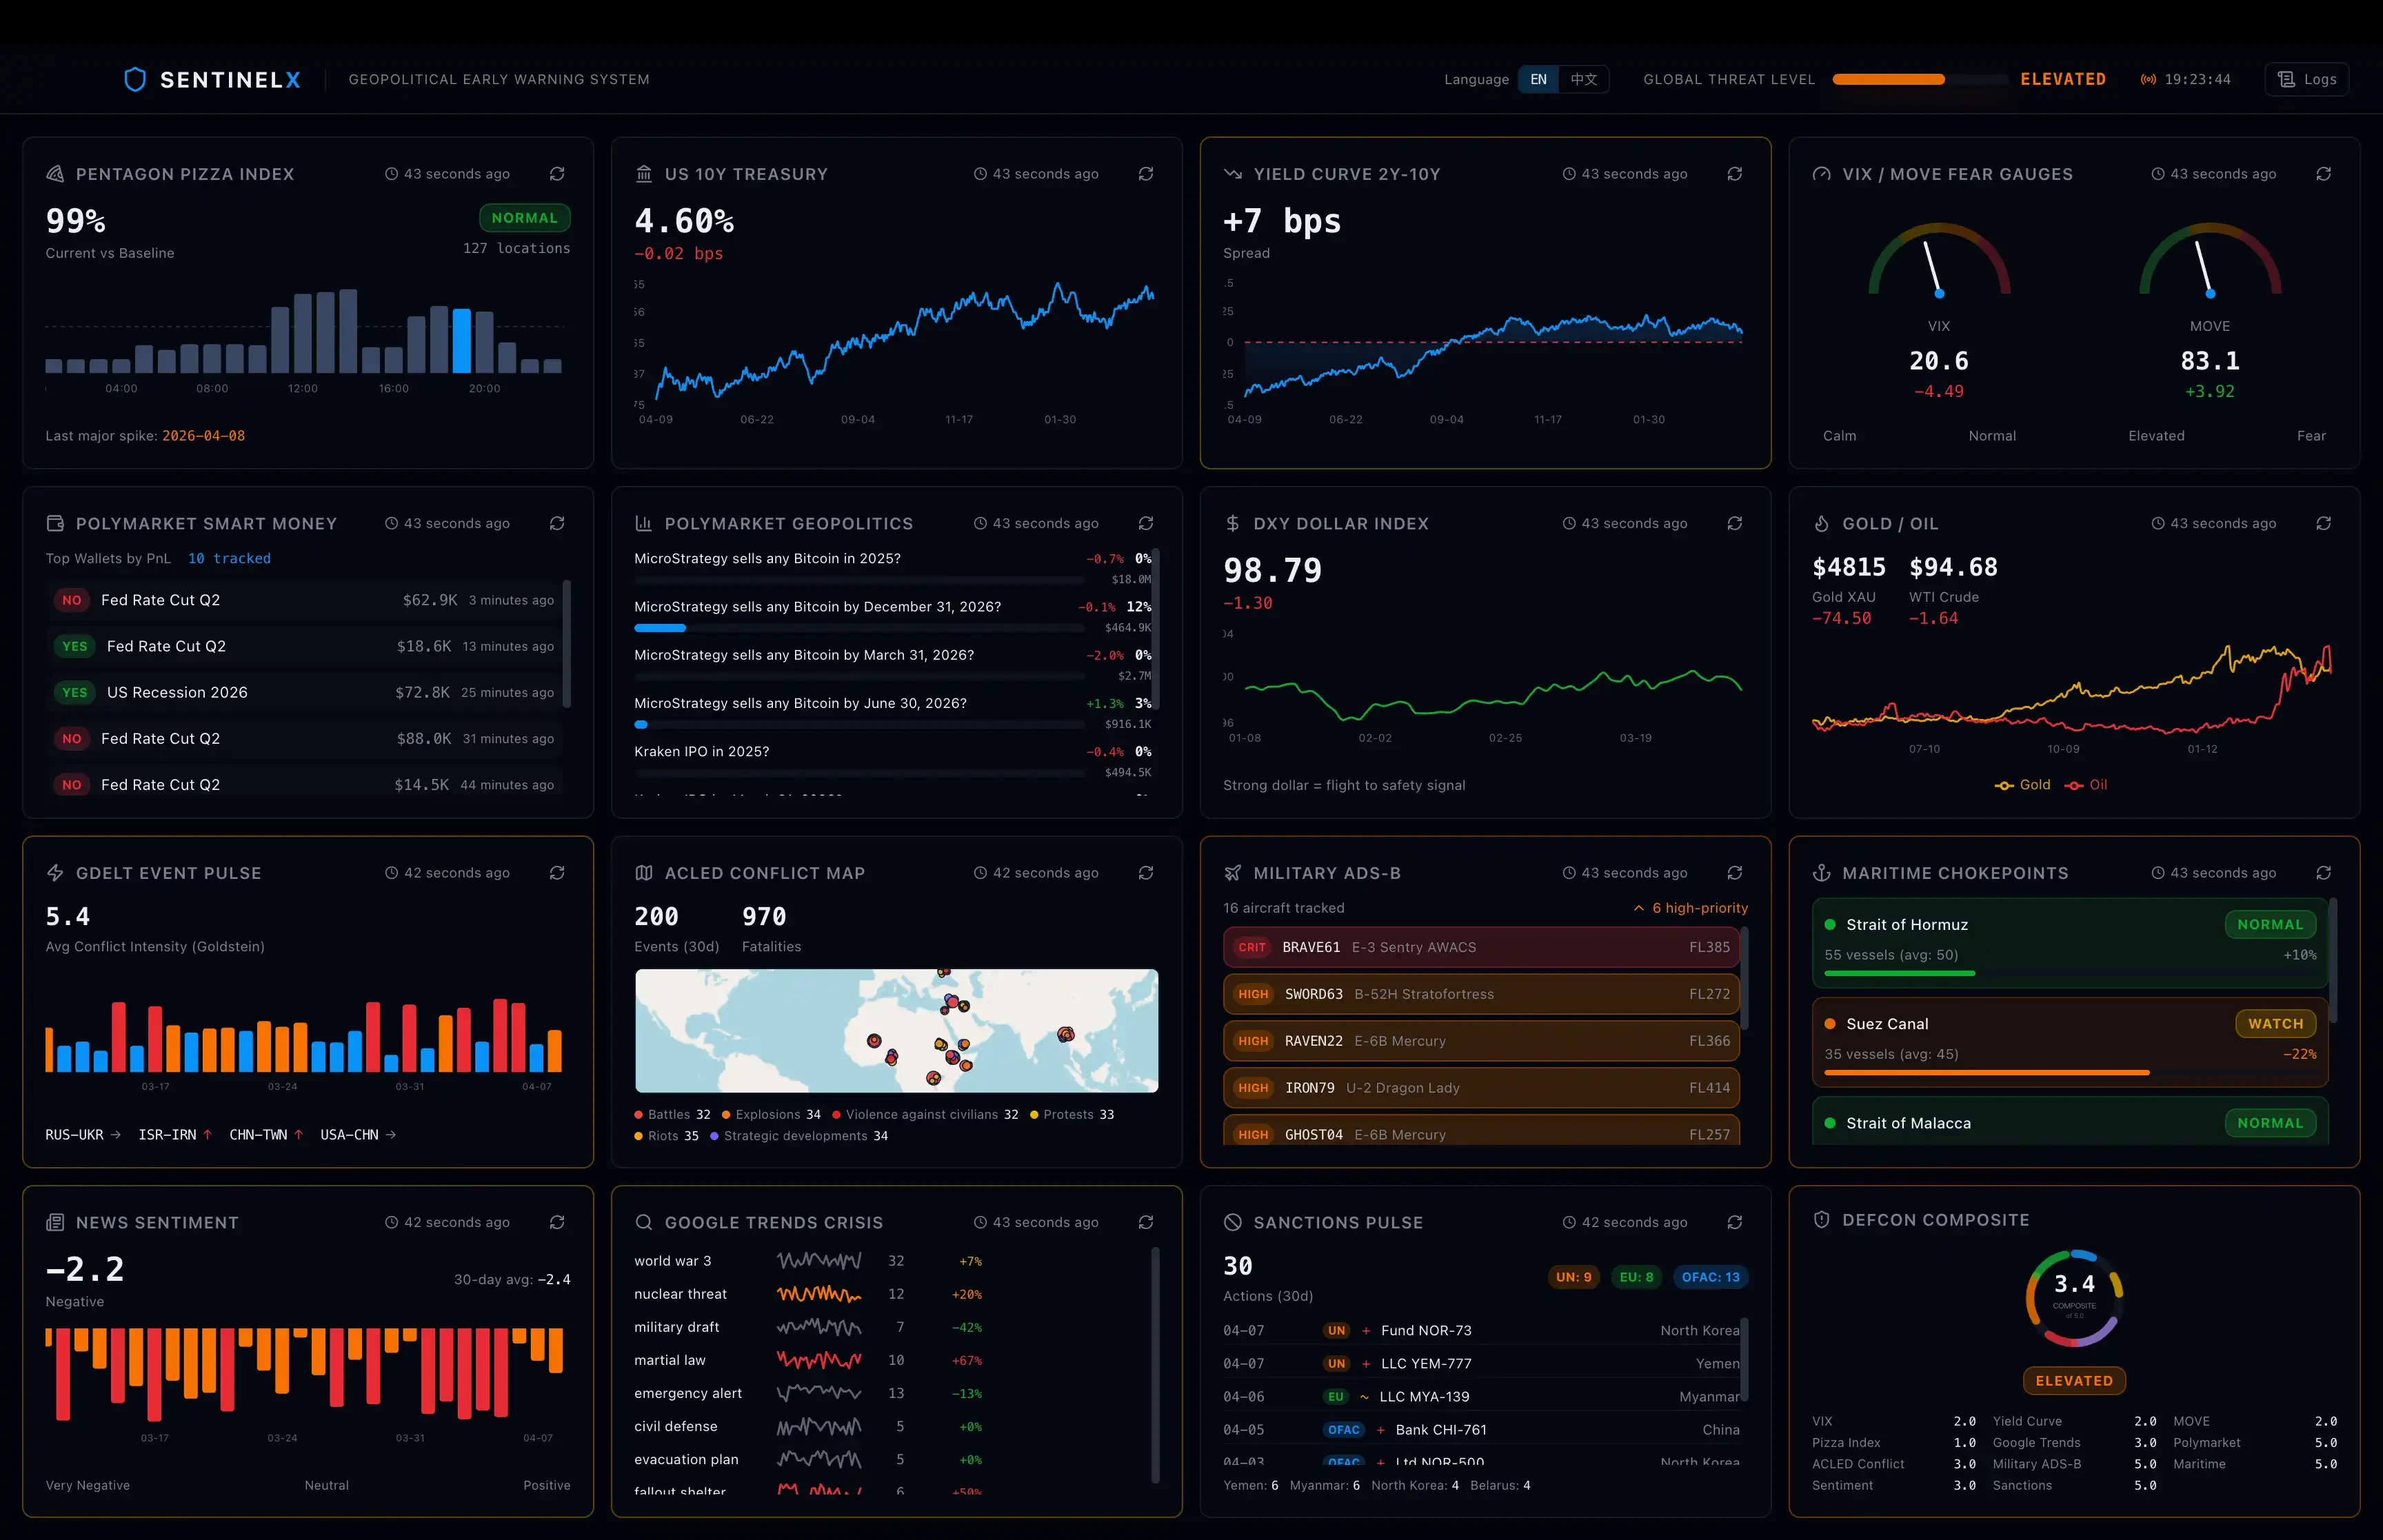
SentinelX is an AI-powered geopolitical risk dashboard designed to surface early warning signals before they hit the market. It aggregates real-time data from financial indicators, global conflicts, open-source intelligence, and sentiment signals into a single command center. Instead of manually tracking scattered sources, users get a unified, continuously updated view of global risk dynamics.
SentinelX was submitted on Product Hunt and earned 0 upvotes and 1 comments, placing #373 on the daily leaderboard. SentinelX is an AI-powered geopolitical risk dashboard designed to surface early warning signals before they hit the market. It aggregates real-time data from financial indicators, global conflicts, open-source intelligence, and sentiment signals into a single command center. Instead of manually tracking scattered sources, users get a unified, continuously updated view of global risk dynamics.
Who hunted SentinelX?
SentinelX was hunted by Yang Qu. A “hunter” on Product Hunt is the community member who submits a product to the platform — uploading the images, the link, and tagging the makers behind it. Hunters typically write the first comment explaining why a product is worth attention, and their followers are notified the moment they post. Around 79% of featured launches on Product Hunt are self-hunted by their makers, but a well-known hunter still acts as a signal of quality to the rest of the community. See the full all-time top hunters leaderboard to discover who is shaping the Product Hunt ecosystem.
Want to see how SentinelX stacked up against nearby launches in real time? Check out the live launch dashboard for upvote speed charts, proximity comparisons, and more analytics.
 Yang Qu