This product was not featured by Product Hunt yet. It will not be visible on their landing page and won't be ranked (cannot win product of the day regardless of upvotes).
React Dashboard: an Ultimate Guide
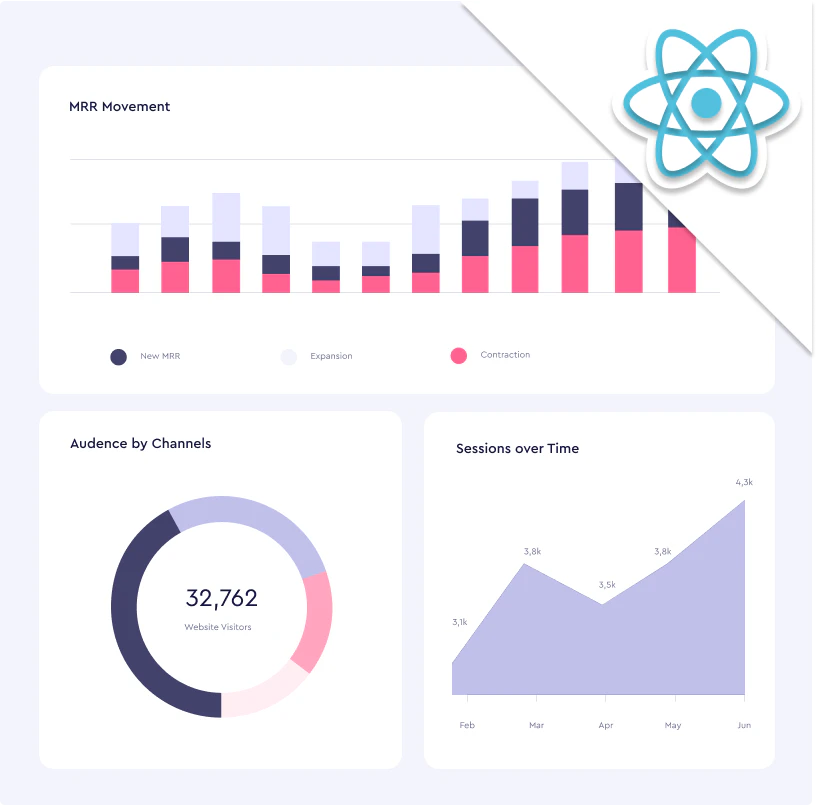
Learn to build a dashboard with React, GraphQL, and Cube.js
An ultimate guide on how to build dynamic analytics dashboards with React. You will learn how to create an API for analytics on top of your database, build beautiful charts, save dashboard data with the AppSync GraphQL backend, and how to authorize your users with AWS Cognito.
About React Dashboard: an Ultimate Guide on Product Hunt
“Learn to build a dashboard with React, GraphQL, and Cube.js”
React Dashboard: an Ultimate Guide was submitted on Product Hunt and earned 24 upvotes and 9 comments, placing #33 on the daily leaderboard. An ultimate guide on how to build dynamic analytics dashboards with React. You will learn how to create an API for analytics on top of your database, build beautiful charts, save dashboard data with the AppSync GraphQL backend, and how to authorize your users with AWS Cognito.
React Dashboard: an Ultimate Guide was featured in Open Source (68.6k followers), Developer Tools (515.9k followers) and Tech (628k followers) on Product Hunt. Together, these topics include over 255.6k products, making this a competitive space to launch in.
Who hunted React Dashboard: an Ultimate Guide?
React Dashboard: an Ultimate Guide was hunted by Artyom Keydunov. A “hunter” on Product Hunt is the community member who submits a product to the platform — uploading the images, the link, and tagging the makers behind it. Hunters typically write the first comment explaining why a product is worth attention, and their followers are notified the moment they post. Around 79% of featured launches on Product Hunt are self-hunted by their makers, but a well-known hunter still acts as a signal of quality to the rest of the community. See the full all-time top hunters leaderboard to discover who is shaping the Product Hunt ecosystem.
Reviews
React Dashboard: an Ultimate Guide has received 3 reviews on Product Hunt with an average rating of 5.00/5. Read all reviews on Product Hunt.
Want to see how React Dashboard: an Ultimate Guide stacked up against nearby launches in real time? Check out the live launch dashboard for upvote speed charts, proximity comparisons, and more analytics.
 Artyom Keydunov