CanvasJS Charts is an HTML5 Charting library that runs across devices and browsers and has 10x Performance Compared to traditional SVG charting Libraries. This allows you to create rich dashboards that work across devices without compromising on maintainability or functionality of your web application.
About CanvasJS Charts v2 on Product Hunt
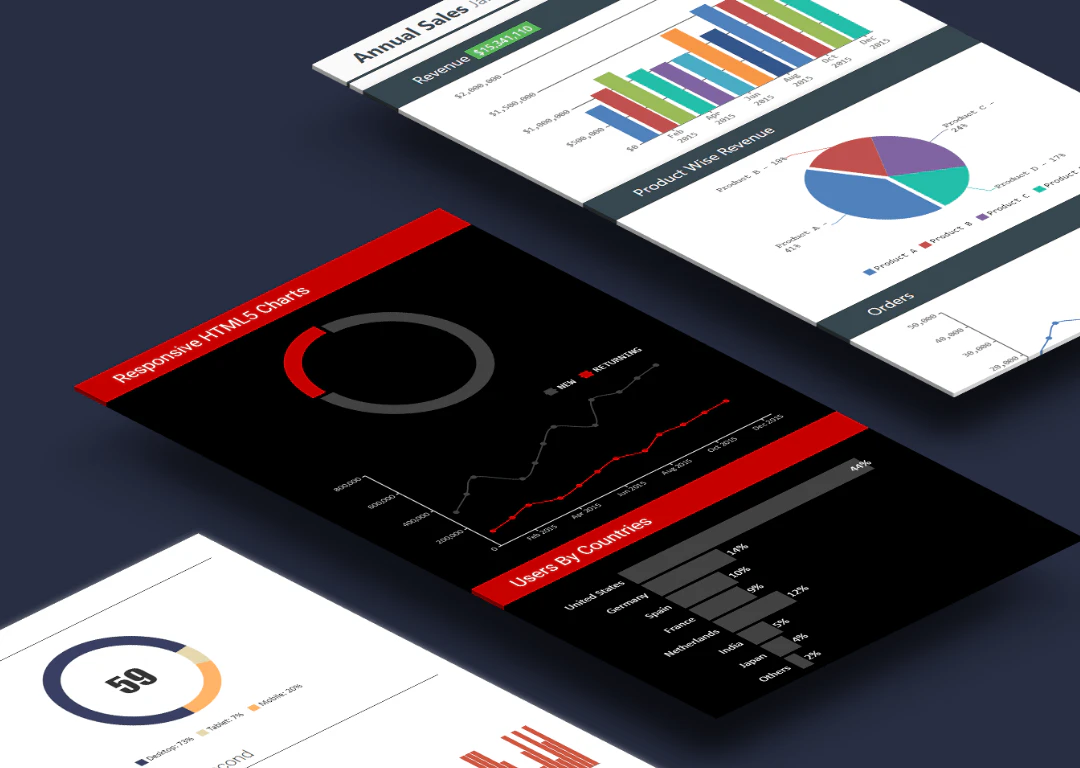
“Responsive HTML5 charts with 10x performance”
CanvasJS Charts v2 launched on Product Hunt on December 1st, 2017 and earned 205 upvotes and 18 comments, placing #4 on the daily leaderboard. CanvasJS Charts is an HTML5 Charting library that runs across devices and browsers and has 10x Performance Compared to traditional SVG charting Libraries. This allows you to create rich dashboards that work across devices without compromising on maintainability or functionality of your web application.
On the analytics side, CanvasJS Charts v2 competes within API, Analytics, Developer Tools and Tech — topics that collectively have 1.4M followers on Product Hunt. The dashboard above tracks how CanvasJS Charts v2 performed against the three products that launched closest to it on the same day.
Who hunted CanvasJS Charts v2?
CanvasJS Charts v2 was hunted by Kevin William David. A “hunter” on Product Hunt is the community member who submits a product to the platform — uploading the images, the link, and tagging the makers behind it. Hunters typically write the first comment explaining why a product is worth attention, and their followers are notified the moment they post. Around 79% of featured launches on Product Hunt are self-hunted by their makers, but a well-known hunter still acts as a signal of quality to the rest of the community. See the full all-time top hunters leaderboard to discover who is shaping the Product Hunt ecosystem.
For a complete overview of CanvasJS Charts v2 including community comment highlights and product details, visit the product overview.
 Kevin William David