This product was not featured by Product Hunt yet. It will not be visible on their landing page and won't be ranked (cannot win product of the day regardless of upvotes).
Product upvotes vs the next 3
Waiting for data. Loading
Product comments vs the next 3
Waiting for data. Loading
Product upvote speed vs the next 3
Waiting for data. Loading
Product upvotes and comments
Waiting for data. Loading
Product vs the next 3
Loading
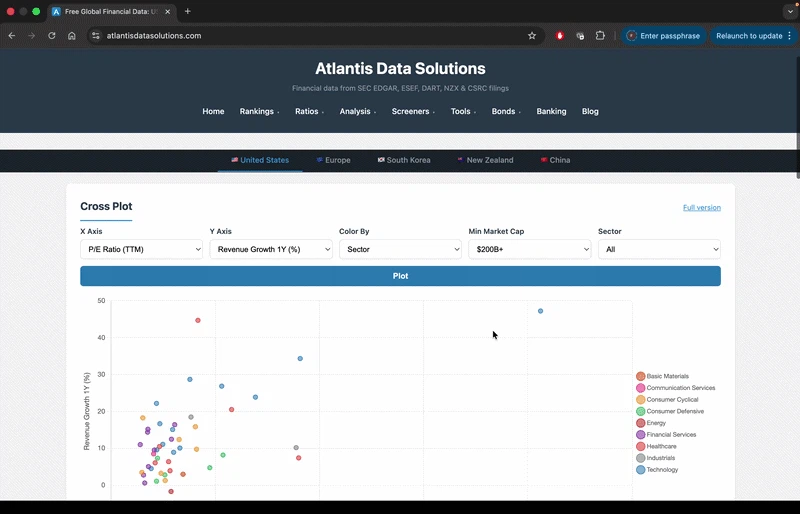
Atlantis Charts — Visual Stock Screener
Start with the chart, then take a deep dive
Start with the chart, and then go as deep as possible. The chart is a visual stock screener. If you click any of the dots, you can take a deep dive into any company's financial. We think we genuinely built the best financial analysis website out there. The data we are making available has been collected over almost a decade now. All from official filings. This was for stock data. The second problem we encountered was bond data for our actuarial models. It is already, but more on that later.
I started the journey a long time ago when I tried to see if you can use neural networks to predict individual stock returns. I realised the real bottle neck would be data. The data I am making available has been collected over almost a decade now. All from official filings. This was for stock data. The second problem we encountered was bond data for our actuarial models. You can't really get yield curves without a Bloomberg subscription. The first yield curves we made available was the single A-curve for US GAAP actuarial valuations but now we have many more. We have many other cool tools. One of the most fun I would say is the cross plot stock screener on the home page.
About Atlantis Charts — Visual Stock Screener on Product Hunt
“Start with the chart, then take a deep dive”
Atlantis Charts — Visual Stock Screener was submitted on Product Hunt and earned 1 upvotes and 1 comments, placing #544 on the daily leaderboard. Start with the chart, and then go as deep as possible. The chart is a visual stock screener. If you click any of the dots, you can take a deep dive into any company's financial. We think we genuinely built the best financial analysis website out there. The data we are making available has been collected over almost a decade now. All from official filings. This was for stock data. The second problem we encountered was bond data for our actuarial models. It is already, but more on that later.
On the analytics side, Atlantis Charts — Visual Stock Screener competes within Fintech, Investing and Artificial Intelligence — topics that collectively have 548.5k followers on Product Hunt. The dashboard above tracks how Atlantis Charts — Visual Stock Screener performed against the three products that launched closest to it on the same day.
Who hunted Atlantis Charts — Visual Stock Screener?
Atlantis Charts — Visual Stock Screener was hunted by francois adp. A “hunter” on Product Hunt is the community member who submits a product to the platform — uploading the images, the link, and tagging the makers behind it. Hunters typically write the first comment explaining why a product is worth attention, and their followers are notified the moment they post. Around 79% of featured launches on Product Hunt are self-hunted by their makers, but a well-known hunter still acts as a signal of quality to the rest of the community. See the full all-time top hunters leaderboard to discover who is shaping the Product Hunt ecosystem.
For a complete overview of Atlantis Charts — Visual Stock Screener including community comment highlights and product details, visit the product overview.
 francois adp